Table of Contents
- 1. Introduction
- 2. How to create a CloudWatch dashboard
- 3. About the sample dashboard
- 4. Using variables
- 5. Conclusion
1. Introduction
AWS provides a service called Amazon CloudWatch to monitor other AWS resources.
If you send your AWS WAF logs to CloudWatch, you can use CloudWatch to monitor AWS WAF's detection status and view the data in the dashboard.
In this blog post, we will take a look at how to create a CloudWatch dashboard using the resources available on GitHub under the CloudWatch Dashboard for AWS WAF repository.
2. How to create a CloudWatch dashboard
You can create a CloudWatch dashboard by following the steps below.
- Configure your AWS WAF to send WAF logs to [Amazon CloudWatch Logs log group] in the [Logging and metrics] page.
- Open CloudWatch in the AWS management console.
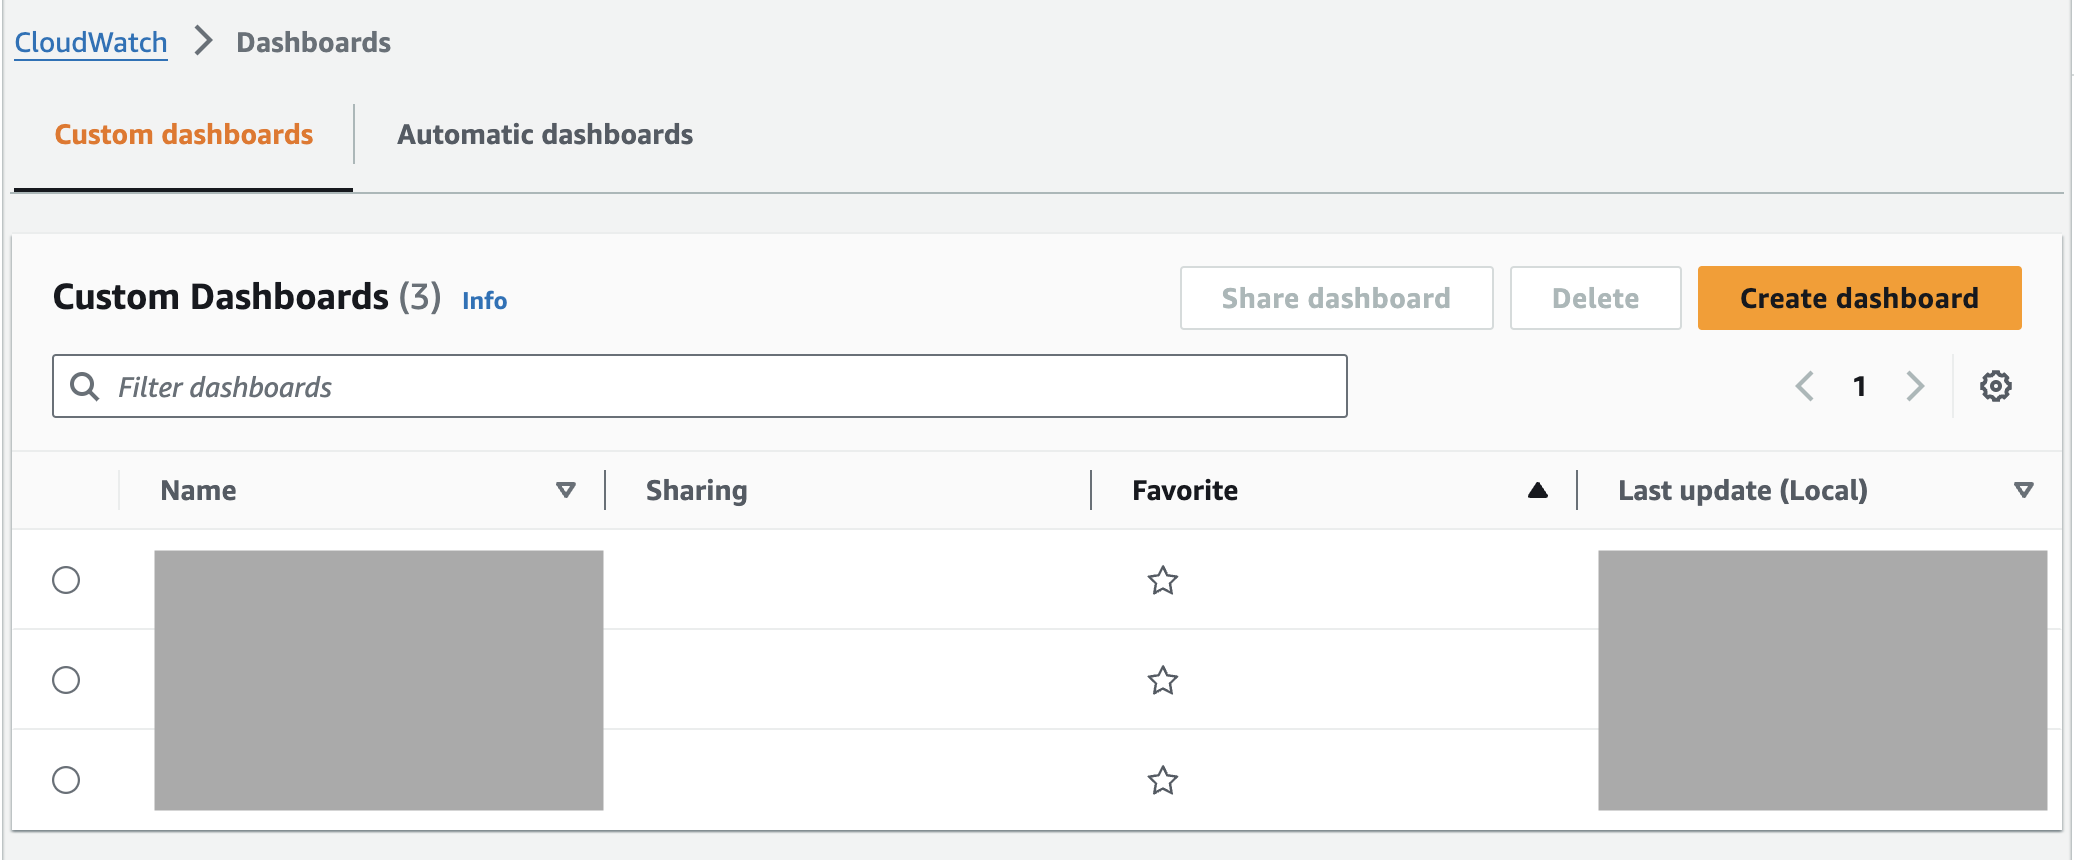
- Click [Dashboard] on the left menu.
- Click [Create dashboard].
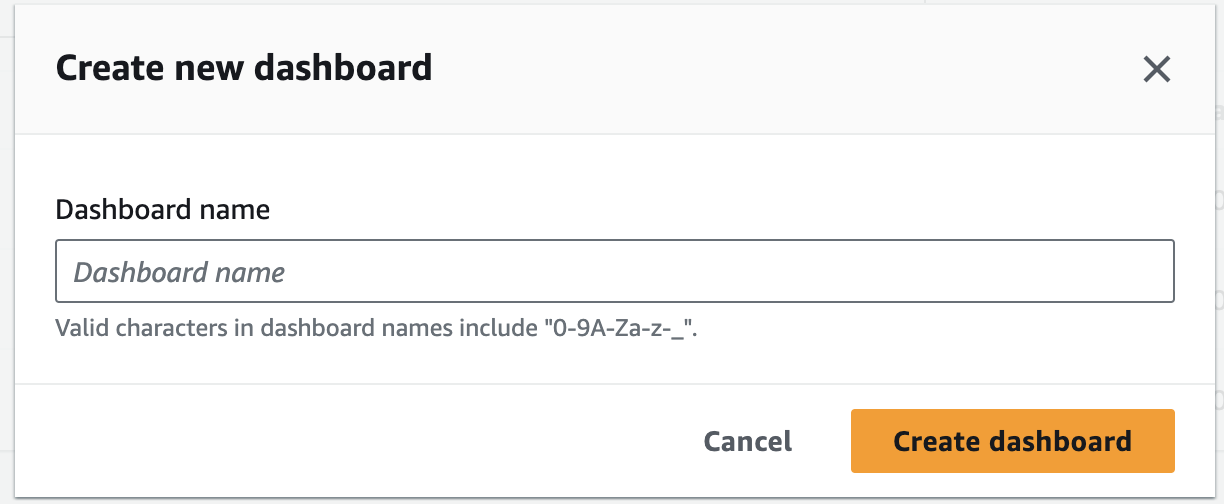
- Enter a name for your dashboard and click [Create dashboard].
- Adjust the data by selecting options such as Metrics and Logs from the [Add widget] pop-up. You can click on the [+] icon on the top right corner to add widgets.
You can use the template from the CloudWatch Dashboard for AWS WAF repository and easily create a dashboard.
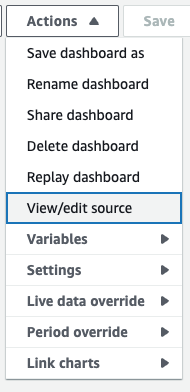
If you already have an existing dashboard and want to add a widget from the repository above, you can click on [View/edit source] from the Action menu and paste the JSON strings from the template.
For JSON syntax, please refer to the AWS document below.
Dashboard Body Structure and Syntax
3. About the sample dashboard
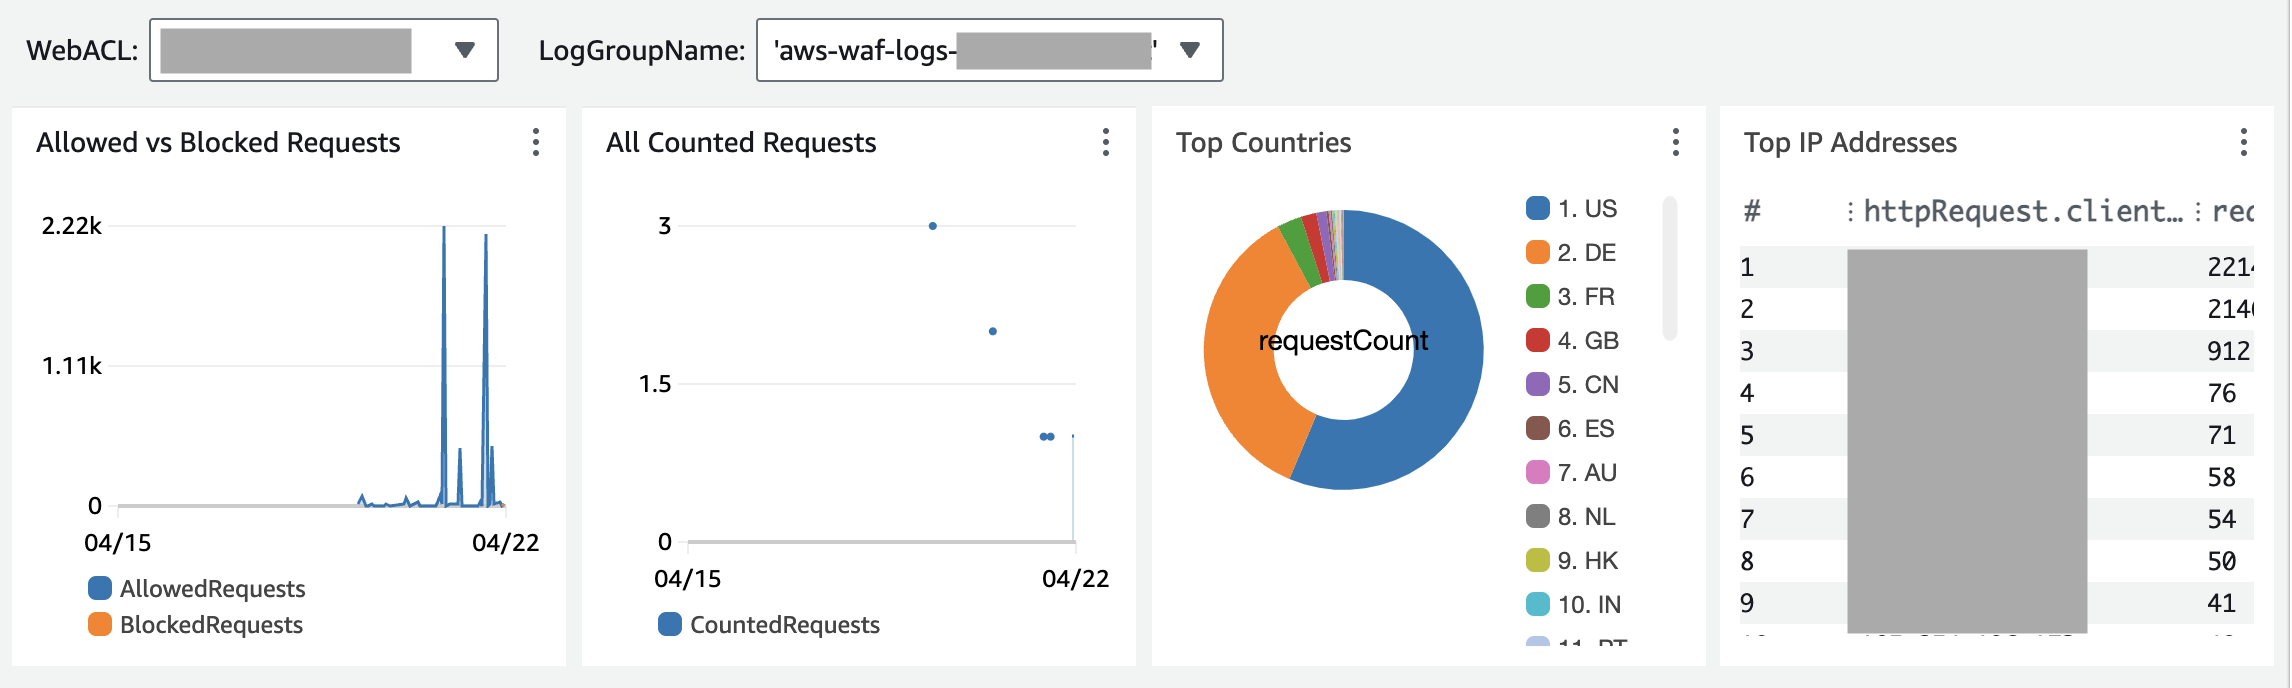
The dashboard using the template will be like the screenshot below.
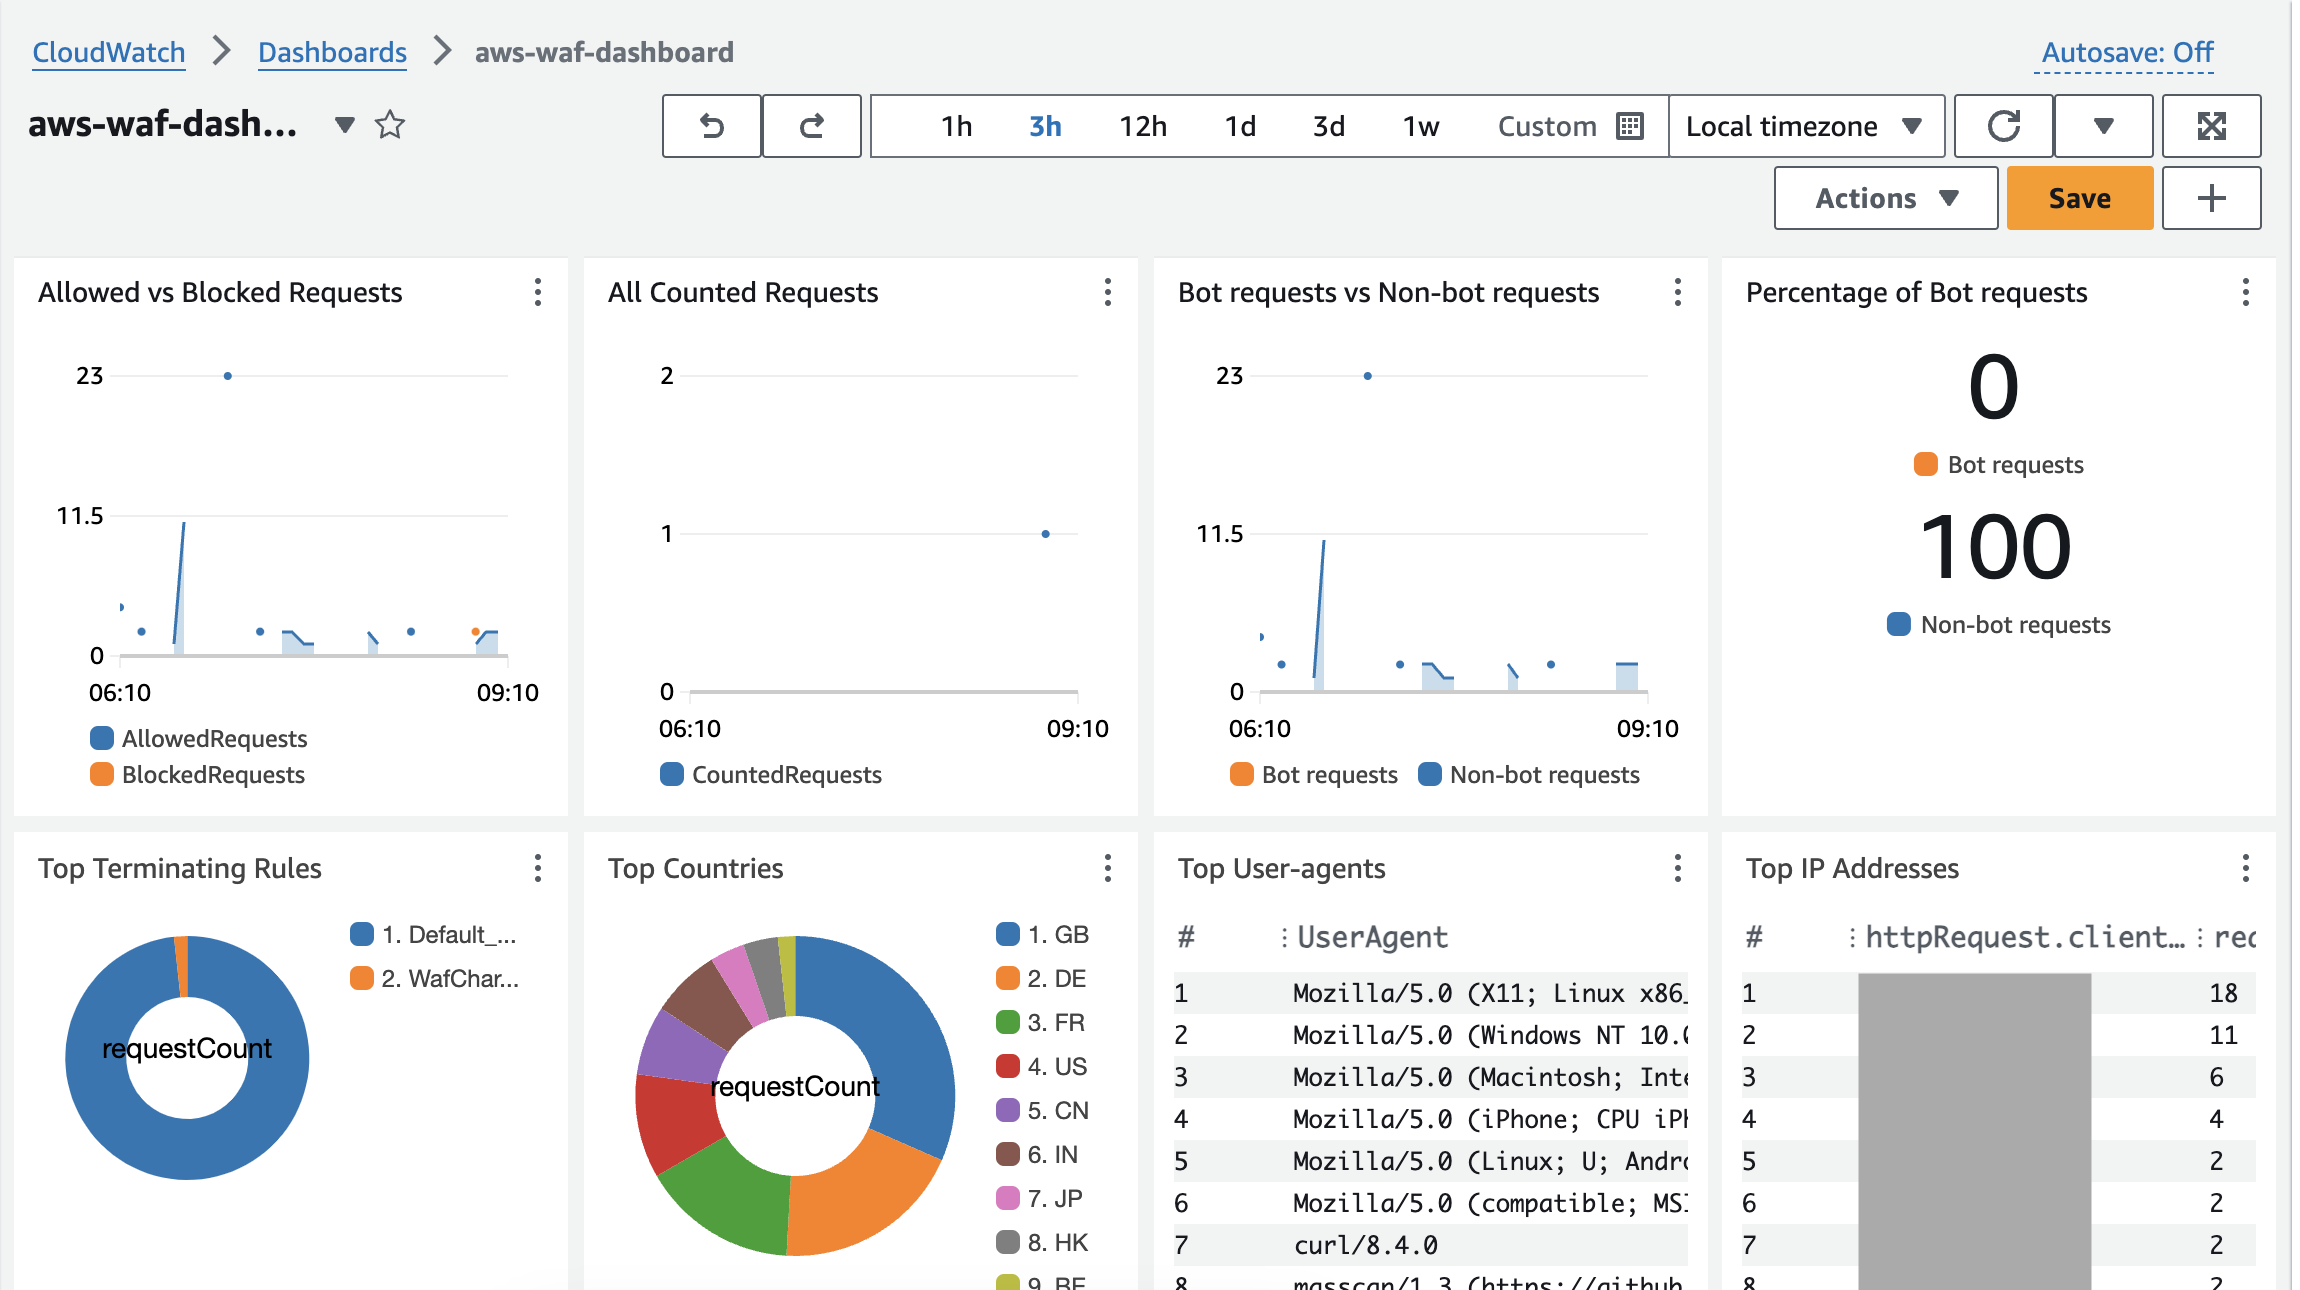
You will be able to see the widgets listed below and can see various data on a single dashboard.
- Allowed vs Blocked Requests
- All Counted Requests
- Bot requests vs Non-bot requests
- Percentage of Bot requests
- Top Terminating Rules
- Top Countries
- Top User-agents
- Top IP Addresses
- Top Counted URIs
- Top Blocked URIs
- Counted Requests
- Blocked Requests
Data about bots uses labels from the Bot Control managed rule provided by AWS. The testing environment used in the sample doesn't use Bot Control managed rules, so the bot-related data is unavailable.
In addition, this template has a widget called [Counted Requests] that searches the logs using the string [COUNT].
There are several ways to use COUNT action within AWS WAF such as using Count action in the rule itself and overriding the default action with Count action, and some require you to use different methods to successfully retrieve the desired data. Searching the string [COUNT] allows the dashboard to show data to cover all scenarios.
Although it may be a rare case, please keep in mind that using the string [COUNT] in the rule name would affect the aggregated data because the rule name would match the string and will be part of the results. When using the template, avoid using the string[COUNT] in your rule name.
*The query is case-sensitive, so [Count] and [count] will not match.
4. Using variables
CloudWatch dashboard released a variable feature on June 30th, 2023.
Amazon CloudWatch now supports dashboard variables
You can switch data based on regions and web ACLs by using variables within the dashboard.
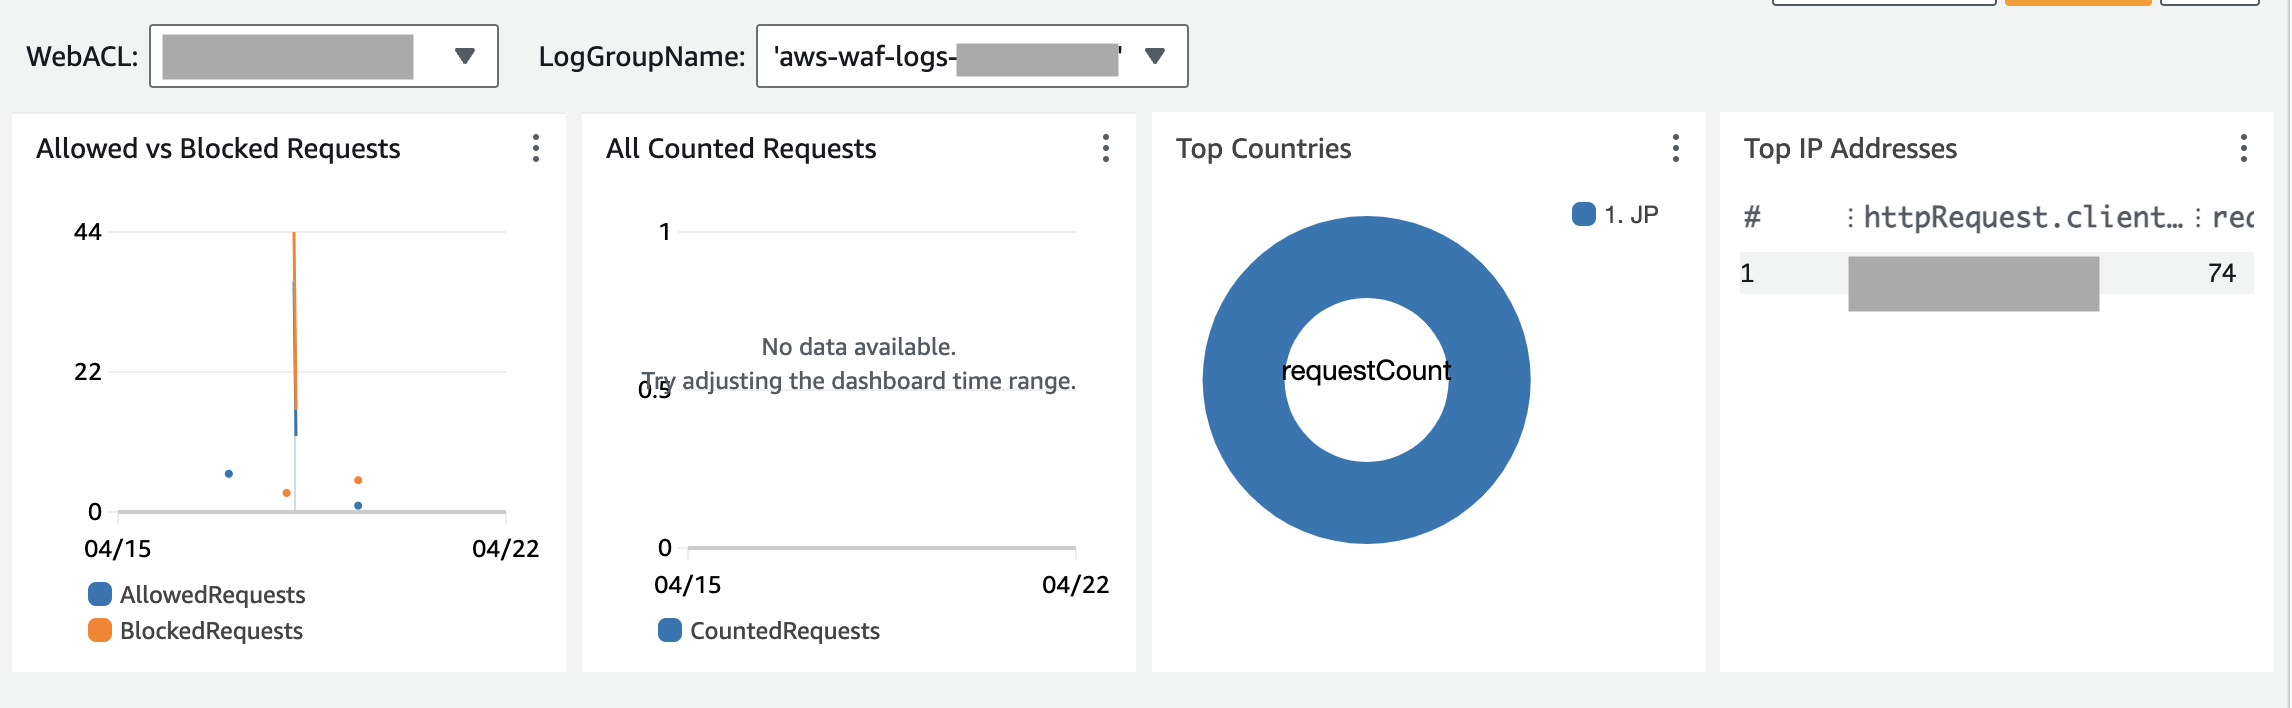
In this example, we tried changing the web ACL name and log group name using some of the widgets available in the template above.
The data in the dashboard changes by switching to other options under the [WebACL] and [LogGroupName] pull-down menu as shown in the screenshot below.
Below is the JSON format sources of the example.
*"WEB ACL NAME" 、 "REGION" 、 "aws-waf-logs-LOGGROUPNAME1,2" must be adjusted according to your environment.
{
    "variables": [
        {
            "type": "property",
            "property": "WebACL",
            "inputType": "select",
            "id": "WebACL",
            "label": "WebACL",
            "visible": true,
            "search": "{AWS/WAFV2,Region,Rule,WebACL}",
            "populateFrom": "WebACL"
        },
        {
            "type": "pattern",
            "pattern": "LogGroupName",
            "inputType": "select",
            "id": "LogGroupName",
            "label": "LogGroupName",
            "defaultValue": "aws-waf-logs-LOGGROUPNAME1",
            "visible": true,
            "values": [
                {
                    "value": "aws-waf-logs-LOGGROUPNAME1",
                    "label": "aws-waf-logs-LOGGROUPNAME1"
                },
                {
                    "value": "aws-waf-logs-LOGGROUPNAME2",
                    "label": "aws-waf-logs-LOGGROUPNAME2"
                }
            ]
        }
    ],
    "widgets": [
        {
            "height": 6,
            "width": 6,
            "y": 0,
            "x": 0,
            "type": "metric",
            "properties": {
                "metrics": [
                    [ "AWS/WAFV2", "AllowedRequests", "WebACL", "WEB ACL NAME", "Region", "REGION", "Rule", "ALL", { "id": "m1" } ],
                    [ ".", "BlockedRequests", ".", ".", ".", ".", ".", ".", { "id": "m2" } ]
                ],
                "view": "timeSeries",
                "stacked": true,
                "region": "REGION",
                "stat": "Sum",
                "title": "Allowed vs Blocked Requests",
                "period": 300,
                "yAxis": {
                    "left": {
                        "showUnits": false
                    }
                }
            }
        },
        {
            "height": 6,
            "width": 6,
            "y": 0,
            "x": 6,
            "type": "metric",
            "properties": {
                "metrics": [
                    [ "AWS/WAFV2", "CountedRequests", "WebACL", "WEB ACL NAME", "Region", "REGION", "Rule", "ALL" ]
                ],
                "view": "timeSeries",
                "stacked": true,
                "region": "REGION",
                "stat": "Sum",
                "title": "All Counted Requests",
                "period": 300,
                "yAxis": {
                    "left": {
                        "showUnits": false
                    }
                }
            }
        },
        {
            "height": 6,
            "width": 6,
            "y": 0,
            "x": 12,
            "type": "log",
            "properties": {
                "query": "SOURCE 'LogGroupName' | fields httpRequest.clientIp\n| stats count(*) as requestCount by httpRequest.country\n| sort requestCount desc\n| limit 100",
                "region": "REGION",
                "title": "Top Countries",
                "view": "pie"
            }
        },
        {
            "height": 6,
            "width": 6,
            "y": 0,
            "x": 18,
            "type": "log",
            "properties": {
                "query": "SOURCE 'LogGroupName' | fields httpRequest.clientIp\n| stats count(*) as requestCount by httpRequest.clientIp\n| sort requestCount desc\n| limit 100",
                "region": "REGION",
                "title": "Top IP Addresses",
                "view": "table"
            }
        }
    ]
}
In this dashboard, [Allowed vs Blocked Requests] and [All Counted Requests] are widgets using metrics.
These widgets use the web ACL names selected in the [WebACL] pull-down menu to show the data from the selected web ACL.
[Top Countries] and [Top IP Addresses] widgets use logs.
The data from logs are shown using a query. Queries in the log widgets are required to use the SOURCE keyword to specify which log group to retrieve the data from.
Simple configurations using property variables weren't available, so we used the pattern variable and regular expressions to change the log group name by specifying the string [LogGroupName] in the query of the source and using that value to replace it with the actual log group name.
Keep in mind that specifying [LogGroupName] as the log group name for the SOURCE keyword in JSON string would cause an error when loading the dashboard because such a log group does not exist.
Choosing a valid log group name from the pull-down menu would rerun the query and show data, but if you want to avoid showing errors when opening the dashboard, set the defaultValue in the JSON string.
For more information on dashboard variables, please refer to Create flexible dashboards with dashboard variables.
5. Conclusion
CloudWatch dashboard allows you to easily aggregate data if you are sending WAF logs to CloudWatch Logs.
Using templates available on GitHub also makes creating the dashboard easier.
When there are multiple web ACLs, it could be helpful to use the dashboard variable feature with one dashboard to switch between data.
It is difficult to use both CloudWatch Dashboard and WafCharm's monthly report/notification detection feature because WafCharm cannot handle WAF logs in CloudWatch log groups, but if you are already sending WAF logs to CloudWatch Logs, creating a dashboard may be a helpful addition to your WAF operation.