Table of Contents
- 1. Introduction
- 2. About Top Insights
- 3. Other dashboard-related features
- 4. Using the dashboard with WafCharm
- 5. Conclusion
1. Introduction
A new section called Top Insights has been added to the AWS WAF Traffic overview dashboard. This feature lets you examine the information available in your WAF logs, such as URIs and IP addresses, on the Traffic overview dashboard if your WAF logs are outputted to CloudWatch Logs.
You can read about Top Insights in the AWS document below.
Web ACL traffic overview dashboards
2. About Top Insights
Top Insights will obtain the information below by querying CloudWatch Logs from AWS WAF.
- URI
- HTTP method
- Client IP addresses
- User-Agent
- Labels provided to requests if matched
- Associated resources
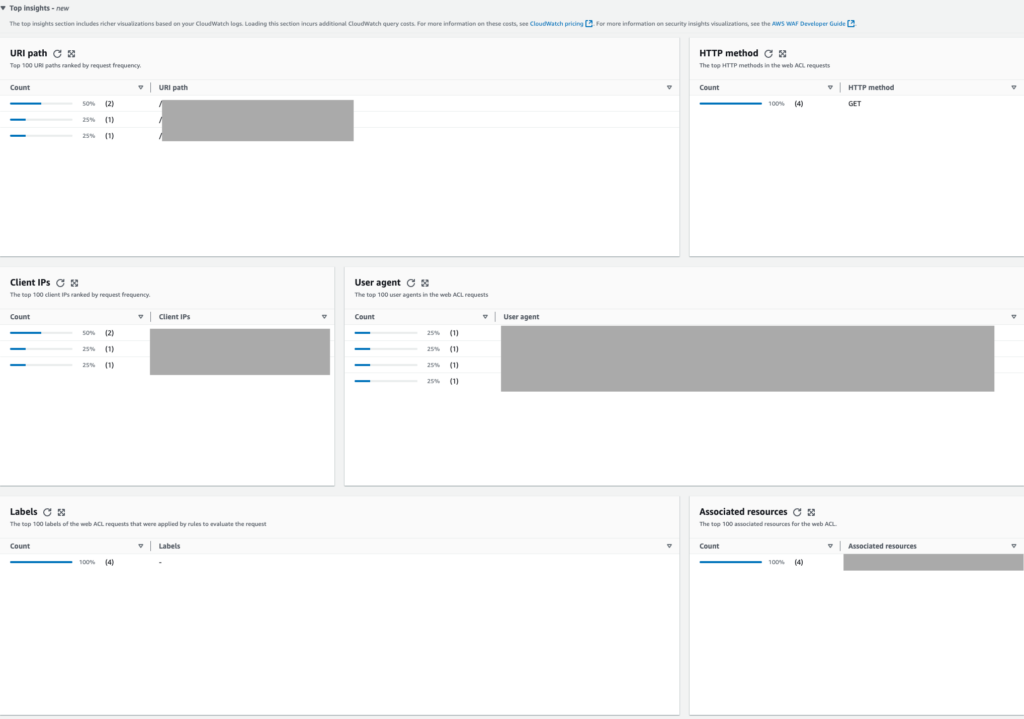
All the information listed above is available in WAF logs. The dashboard only shows information such as the top 10 detected rules and countries, but with Top Insights, you can easily see which URIs receive more requests, what IP addresses and User-Agent requests are coming from, and so on.
If you have multiple resources associated with the web ACL, Top Insights will make it easier for you to see which resources receive how many requests by looking at the [Associated resources] panel.
Please note that if you choose S3 bucket or Data Firehose in the logging configuration, the Top Insights section will not be available. If you want to check what the Top Insights section will look like in your environment, then you must enable logging with CloudWatch Logs. Once you enable logging with CloudWatch logs, a message [Top insights is now available!] will be shown at the top of the dashboard.
3. Other dashboard-related features
You can view and analyze WAF logs in CloudWatch Logs using methods explained in the blog posts below.
Analyzing AWS WAF logs using Amazon CloudWatch Logs (for WafCharm rules)
How to create AWS WAF dashboard in CloudWatch
You can create OpenSearch Dashboards from CloudWatch
There are multiple ways to view information using a dashboard. If you want to use a dashboard with detailed information, you might want to use CloudWatch Dashboards or OpenSearch instead.
4. Using the dashboard with WafCharm
The WAF log integration feature on WafCharm is incompatible with CloudWatch Logs, so it cannot be used together with the Web ACL traffic overview dashboard (Top Insights).
5. Conclusion
You can use various features such as dashboards and easy visualization by enabling the web ACL’s logging configuration with CloudWatch Logs. If you already have the logging feature enabled with CloudWatch Logs, you can use Top Insights on AWS WAF without any additional configurations.
However, as stated above, Top Insights queries WAF logs in CloudWatch Logs and will incur the added costs of querying the CloudWatch logs.