Table of Contents
- 1. Introduction
- 2. How to create an OpenSearch Dashboard
- 3. Visible information on the dashboard
- 4. Using the dashboard with WafCharm
- 5. Conclusion
1. Introduction
You can now create an OpenSearch dashboard via Amazon CloudWatch.
Amazon CloudWatch and Amazon OpenSearch Service launch an integrated analytics experience
It is not very easy to create OpenSearch Dashboards from scratch, but with this feature, you can easily create an OpenSearch Dashboard from the CloudWatch console. In this blog post, we will take a look at how to create a dashboard for AWS WAF.
2. How to create an OpenSearch Dashboard
We will use the procedures available in Analyze with Amazon OpenSearch Service. If you are going to follow along, please make sure that you have the necessary permissions, such as CloudWatchOpenSearchDashboardsFullAccess on the AWS account you are using.
We are going to use the WAF logs in CloudWatch Logs, so please check that your WAF logs are also outputted to CloudWatch Logs.
- Open the CloudWatch page.
- Open Logs Insights and click [Analyze with OpenSearch].
- If you haven’t configured the OpenSearch integration yet, you will see a panel that says [Create OpenSearch integration]. Click the [Settings] button to proceed.
- You can also configure OpenSearch integration from the [Logs] tags under the [Settings] in the left menu. Click [Create integration] to start configuring the integration.
*One OpenSearch integration is available per region. If the OpenSearch integration has been completed in the region, you will be able to see the information about the integration. - Enter the values in the Integration name and Data retention.
- Create a new IAM role for the IAM permission. An IAM role with the necessary permissions will be automatically created. Select the IAM roles and/or users to allow to view the dashboards as well.
- Click [Create integration].
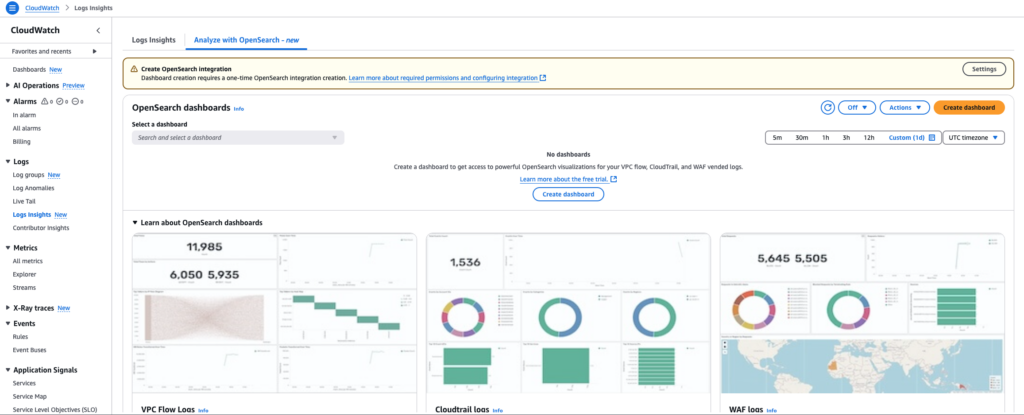


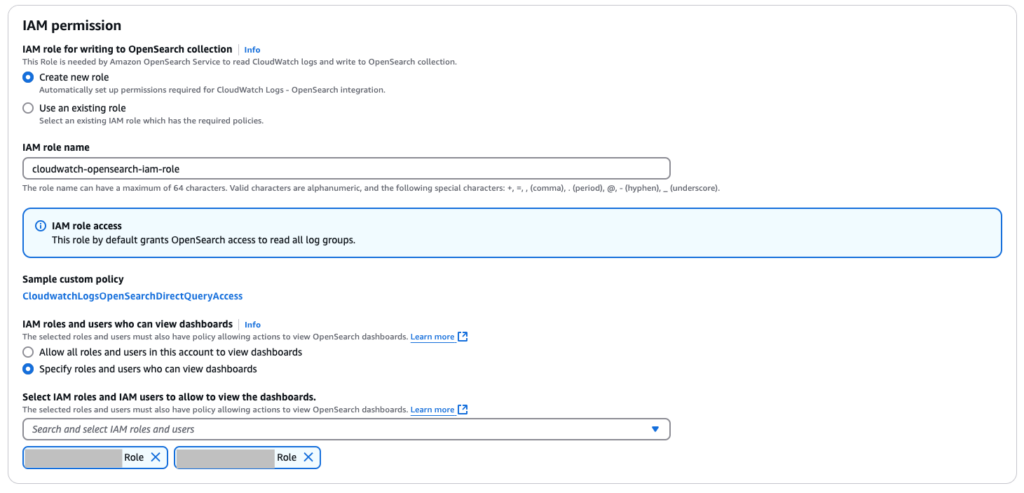
It may take a while for the creation to complete. Once the integration is created, you will be able to see the information related to it under the Logs tab in the Settings page, as shown in the screenshot below.
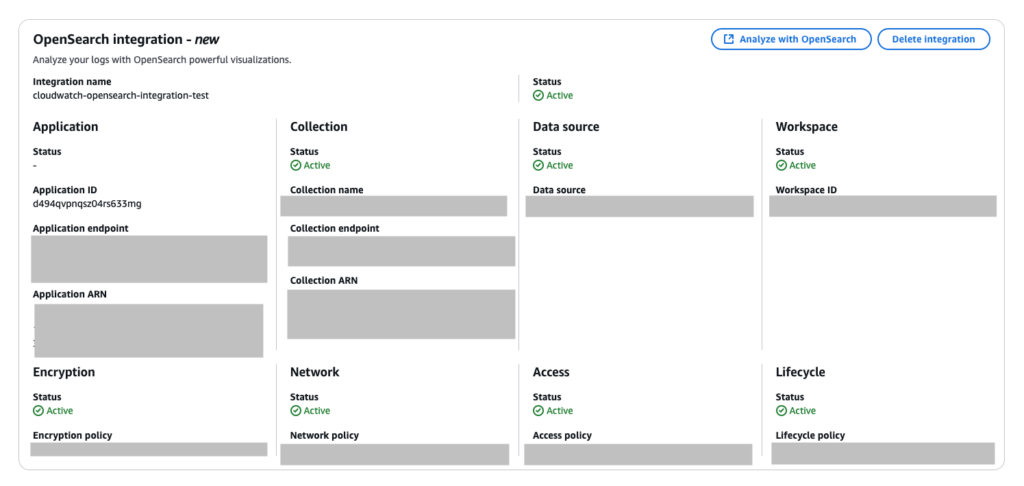
Next, we will create a dashboard.
- Open Logs Insights again and click [Analyze with OpenSearch].
- Click [Create dashboard].
- Select [Amazon WAF logs] under [Select dashboard type].
- Enter Name and Description.
- Select the log groups to use under [Select log groups].
- Click [Create dashboard].
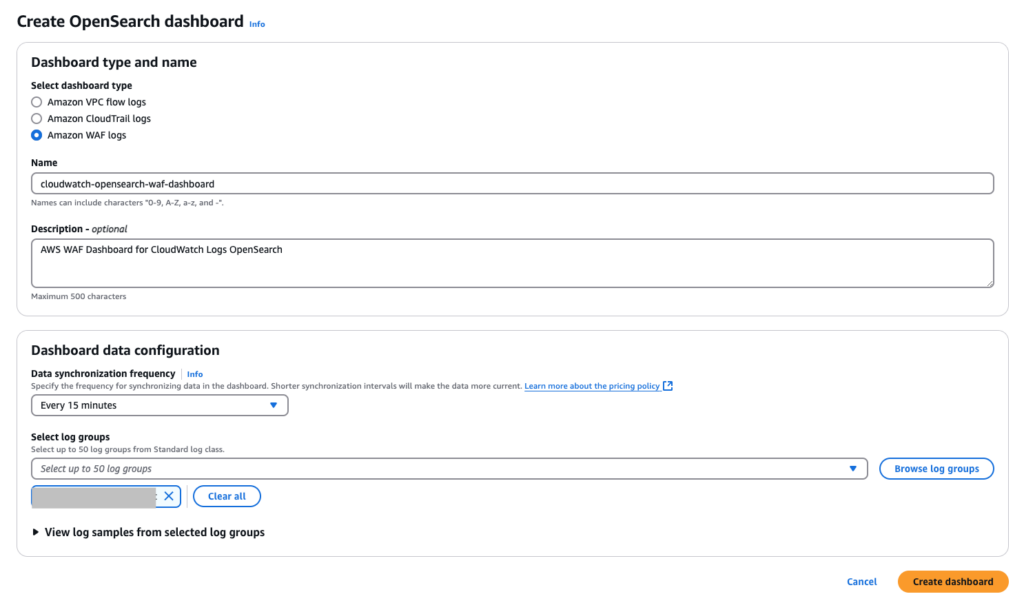
The dashboard will be visible in the CloudWatch console once the dashboard is created, as shown in the screenshot below. The data may take a while to be updated.
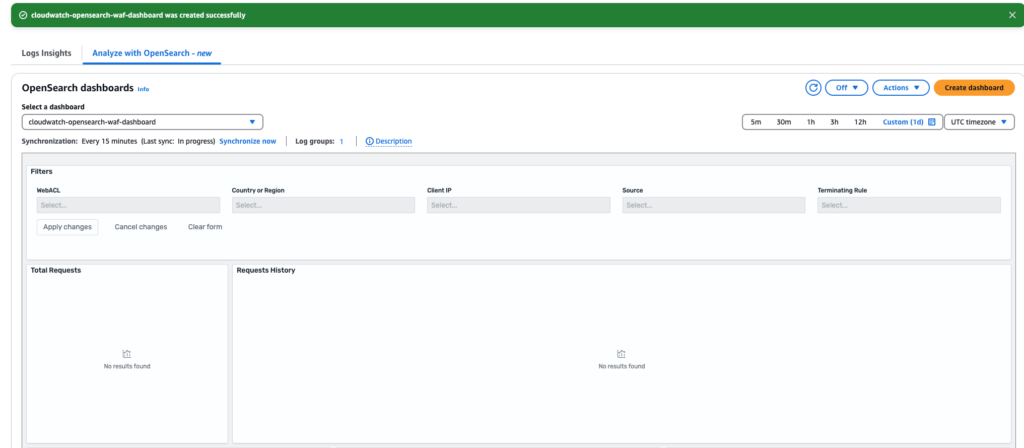
You can choose between UTC timezone and Local timezone in the CloudWatch Dashboard, but in the OpenSearch dashboard, you may not be able to see the data with Local timezone depending on where you are located. In that case, check if you are selecting UTC timezone instead of Local timezone.
In addition, the dashboard may not be selected right after opening the [Analyze with OpenSearch] tab. In that case, click the [Select a dashboard] pull-down to select the dashboard name.
3. Visible information on the dashboard
The graphs listed below are available in the created dashboard.
- Blocked Requests by Terminating Rule
- Country or Region by Requests
- Filters
- Requests History
- Requests to Web ACL Name
- Sources
- Top 10 Client IPs
- Top 10 Terminating Rules
- Total Requests
You can also see the dashboard from OpenSearch. If you open OpenSearch, the menu to add visualizations (graphs) is available. However, when we added visualization from OpenSearch, the dashboard became invisible from the CloudWatch’s OpenSearch Dashboard page. The dashboard name in the [Select a dashboard] pull-down became unavailable, so it seems like we should avoid adding original visualizations from OpenSearch. The actual dashboard in OpenSearch will not be deleted, but it might be inconvenient not to be able to see the dashboard from the CloudWatch console.
The indexed data in OpenSearch are as below.
- aws.waf.RuleType
- aws.waf.action
- aws.waf.event_count
- aws.waf.httpRequest.clientIp
- aws.waf.httpRequest.country
- aws.waf.httpRequest.httpMethod
- aws.waf.httpRequest.uri
- aws.waf.httpSourceId
- aws.waf.ruleGroupList.ruleId
- aws.waf.terminatingRuleId
- aws.waf.webaclId
- start_time
[aws.waf.ruleGroupList.ruleId] appears to be an index for obtaining rule names within a rule group, but in reality, it seems that the names of the rules contained in the rule group cannot be obtained. When we checked the value available in the [aws.waf.ruleGroupList.ruleId] field, it mostly said [UNKNOWN_GROUP]. The rule names in the rule group are provided under the [ruleGroupList.terminatingRule.ruleId] field within WAF logs, so we believe that this field should be indexed instead. Currently, it seems like the rule names cannot be obtained because [terminatingRule] is missing from the actual index.
Because WafCharm uses rule groups, it is not easy to figure out which rule within the rule group detected a request from the dashboard. [aws.waf.terminatingRuleId] refers to an item [terminatingRuleId] in WAF logs, but this item only provides the names of the rule groups when the requests are detected by a rule within a rule group.
4. Using the dashboard with WafCharm
The WAF log integration feature on WafCharm is incompatible with CloudWatch Logs, so it cannot be used together with the OpenSearch Dashboard.
5. Conclusion
Creating OpenSearch Dashboards has been made easier if WAF logs are already outputted to CloudWatch Logs. As mentioned above, there are restrictions, such as not being able to edit the dashboard and not being able to see the names of the rules within a rule group, so it may require a bit of operation adjustment, but it is beneficial to be able to create a simple dashboard easily.
The OpenSearch dashboard might be useful for viewing information from multiple Web ACLs together, so it might be worth considering.


